What is a Gantt chart and how to build one
A Gantt chart is often used to display tasks and processes in projects. This is a special tool of project management, realized in the form of two digital axes, one of which displays tasks, and the other – the time of their fulfillment. It is convenient for tracking the sequence, priority, and progress of tasks.
This method of project planning is suitable for different areas of activity. Using a linear tool, it is convenient to control all the work processes performed within the project. Gantt charts allow you to manage everything in time and not forget anything. We suggest that you consider the main characteristic of this gantt chart and find a real application for it.
What a Gantt chart is and how it works
The authorship of this planning method belongs to Polish engineer Karol Adamecki. He came up with the idea of displaying work processes as a visual representation of a diagram.
A little later, the use of a similar form was suggested by the American engineer Henry Gantt, who worked in the field of military shipbuilding. He developed a methodology that allowed to graphically display construction activities to demonstrate the degree of work completion and their percentage of deviation from the project. This discovery would later become very popular in various fields and be named in his honor.
Nowadays, Gantt Chart is actively used in project management. This method is suitable for anyone who wants to learn how to manage their time and affairs.
What is a Gantt chart for in ordinary life or business? It gives an overview of the following elements of a project:
- Objectives.
- Start and end date.
- Assignment Deadlines.
- The time required to implement them.
- Possible ways to integrate multiple tasks.
- Assigned responsible persons.
You can add any other information that is relevant to the business to the chart. For example, deadlines (milestones) and so on.
Where the Gantt chart is used
This tool is most often used in the fields of software development and marketing. But that doesn’t mean that it can’t be used in ordinary life. If you are used to visualizing your tasks, it will definitely be convenient for you.
The advantages of the method include:
- increasing the efficiency of team interaction;
- visualization of tasks and deadlines;
- identifying critical points of the project;
- tracking progress on project tasks;
- organization of personnel workload management;
- optimal planning and distribution of tasks among employees.
A Gantt chart is necessary:
- When planning large marketing campaigns. The information displayed on it will show employees their areas of responsibility. It will show how the work of each of them will affect the overall process.
- When demonstrating the results of the work to clients. The method will clearly show in what terms it is realistic to fully complete the project. Provides information about the necessary actions to be taken for its successful completion.
- When planning a new product launch. An entire development roadmap can be depicted on the diagram. Using a gantt chart, you can prevent possible conflicts between tasks. Assume dependencies between project phases.
This method of visualization is suitable for all projects related to the parallel execution of several tasks. For example, within the framework of production, products are produced, specialists are trained, and new products are planned. The Gantt chart allows you to determine which capacities are occupied and which remain idle. Visual examples help to identify and eliminate bottlenecks in a timely manner, avoid additional costs and optimize production.
In IT, the use of diagrams to visualize planning helps to simplify collaborative work on a project. It shows deadlines for each task, specifies responsible persons, and dates of completion of each stage of work. In the course of joint work, the team will only have to mark the degree of readiness of tasks and track possible deviations from the project.
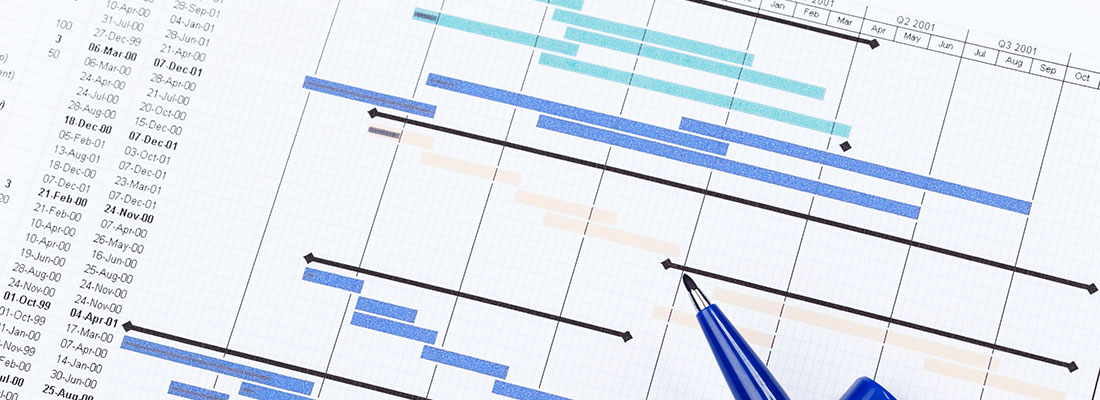
What a Gantt chart looks like

Today, specialized electronic applications are used to create line charts, in which the necessary data are entered. The diagram consists of two scales: horizontal and vertical. Vertical – it is necessary to describe the tasks to be solved. On the horizontal – the time required for their fulfillment is indicated. The arrows between the tasks serve as dependencies, i.e. they indicate the order in which the work should be followed and done.
The length of the horizontal bars indicating the tasks to be performed at each stage depends on the deadlines for their realization. To better understand how to make a Gantt chart, let’s look at the different variants of its creation.
Various methods and tools can be used for compilation, ranging from an ordinary sheet of paper to specialized software that allows you to build a Gantt chart in an automated mode. Regardless of the method chosen, the following steps should be followed:
- Determine the start and completion time of the project.
- Add start and end times for each task present in the project.
- Highlight co-dependent elements in a project. Or tasks that cannot be started until the previous ones are completed.
- Specify the milestones of the project. That is, checkpoints by which you need to achieve a certain result.
- Make adjustments in a timely manner when the plan changes.
Building a Gantt chart on paper
Make a list of the tasks scheduled for completion. Arrange them on a vertical scale in the order in which they are to be completed. On the horizontal time axis, display the time divisions indicating the time intervals required for the final completion of all tasks. Between these axes, draw the tasks as bars, measuring horizontally the time required to complete them.
Assign a responsible person or several persons to perform the task. Make sure that the tasks are evenly distributed among them.
This method of construction is suitable for small companies with minimal production load.
Excel spreadsheets
Using this simple and popular method, you can effortlessly build Gantt charts in automation mode. To create a Gantt chart, you enter the necessary project data into the table and select the linear Gantt option in the menu. The obtained result is transferred to a convenient place for presentation, and the creation of Gantt charts is completed by customizing the display.
The data in the tables for the Gantt chart are entered manually. When working with vast amounts of information, you can use ready-made templates.
Google Spreadsheets
The working principle of these tables is similar to Microsoft Excel. But the process of creating a Gantt chart in this service differs from the previous variant:
- A table with data for the project is created.
- The free columns to the right of the table contain the planned dates of the project.
- A gantt chart is drawn in the free field between data and dates allocated for construction.
- The “Conditional Formatting” function is selected from the “Format” menu.
- In the opened tab select the item: “Add Rule”, “Your Formula”. In this box you enter the address of the first cell of the row with dates, the address of the field with the date of completion of the first task and the date of its beginning. By substituting in the formula: = AND(E$1<=$C2;E$1>=$B2) your data, you can create a project diagram.
If all conditions are met exactly, we will get a view in a Gantt chart that can be shared with colleagues.
Microsoft Project
A special offer from Microsoft for project management with built-in Excel, PowerPoint, Skype and various additional customizations.
Designed for representatives of medium and large businesses seeking to visualize project information. For the convenience of users, the program contains a Gantt chart template, so it will not have to be filled out manually.
LibreOffice Calc
Another competitor of Excel spreadsheets. The order of work in it will be similar. It is necessary to fill a table with data and make a line chart with an accumulation function on its basis. You can make beautiful circular, ribbon gantt charts and build histograms, triangles for reports. The chart additionally includes data on work duration and formatting. The program is completely free of charge.
Online applications
This category includes modern programs that allow you to create Gantt charts online.
GanttPRO
The application is suitable for maintaining different number of projects, organizing joint work in teams. In it you can make descriptions, changes to tasks, deadlines by dragging and dropping gantt elements with the mouse. The application contains functions:
- Resource Management;
- Creating, editing a working Gantt chart;
- Making adjustments to the cost of projects.
The Gantt chart created in the application can be exported to the customer or provided to the interested parties by link, put away in a reserve. To start working with the program, it is necessary to fill out a questionnaire, on the basis of which a suitable sample template will be set aside. Further it can be modified “for yourself” if necessary. On the developer’s website there is a large amount of training literature for working with the program and designing.
Comindware
A popular application designed to manage resources, projects, and business processes in large and medium-sized companies. The platform’s functionality even includes its own corporate social network for communication and information exchange. The ability to import files from tables, transfer projects and tasks from MS Project is supported.
OnlyOffice
A service that combines CRM, corporate chat, blog and mail server capabilities. The listed options are opened after registration. You can build a Gantt chart in the application automatically after adding tasks. Due dates of tasks, links between them can be set directly on the diagram, using the mouse to drag and drop them. To facilitate work with charts, the program contains hints.
LeaderTask
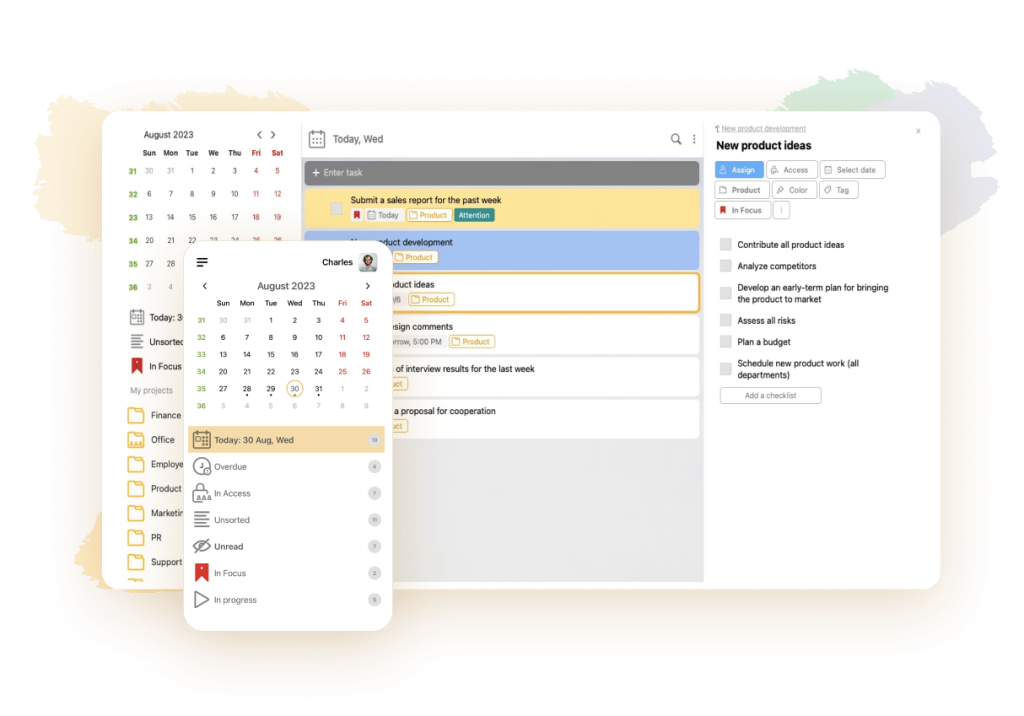
With the help of LeaderTask scheduler you can create projects of any scale, organize work in a team, monitor the efficiency of each team member. The service supports the function of creating diagrams. It allows you to:
- Clearly see the name, timeline of the project.
- Make task lists for the day, week, month, and make edits to them.
- Distribute them in order of importance and priority.
- Fact/Plan tool for tracking time spent.
- Set deadlines, performance standards.
- Observe progress in problem solving.
- Exercise control over assignment due dates.
- Enter modified project data in online and offline modes.
The application has a calendar planning function. LeaderTask synchronizes with any type of digital devices. It is compatible with many popular services. Supports the ability to work offline, without internet access.
Conclusion
After a brief analysis we can say that visualization of workflows facilitates project management. It helps to improve team interaction, organize and track the tasks of each participant. Graphical display of information using a diagram is one of the most effective planning methods used in time management.
You can create your own diagrams using any number of methods. For example, build them manually on a sheet of paper, in Word or in Excel spreadsheets. But, it is more convenient to use special applications for gantt, in which you can quickly create your own project, assign deadlines, tasks, executors and control its execution at every stage.
-
 20 Best To Do List Apps
A to do list app enables you to compose a checklist of
20 Best To Do List Apps
A to do list app enables you to compose a checklist of -
 Agile manifesto
In the early 2000s, a real revolution took place in the IT
Agile manifesto
In the early 2000s, a real revolution took place in the IT -
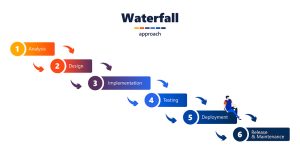 Waterfall methodology
Various systems and methods are used in project management. Among them is
Waterfall methodology
Various systems and methods are used in project management. Among them is -
 Project goals and objectives
The first step in developing any project is proper goal setting. This
Project goals and objectives
The first step in developing any project is proper goal setting. This